
- Interpreting the ECG
A rhythm strip has been recorded to help determine the next course of action. Use the 6-stage approach to interpret the rhythm strip.
Examine each image and select your responses. When you are ready, select confirm to receive your feedback.
Case 1
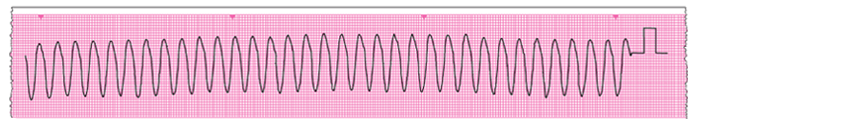
- 1. Is there any electrical activity?
-
Case 2
- 2. Is the ventricular (QRS) rate normal?
-
- 3. Is the QRS rhythm regular?
-
- 4. Is the QRS complex width normal?
-
Case 3
- 5. Is atrial activity present?
-
References
See chapter 11 of the ALS manual for further reading about the tachycardia algorithm.
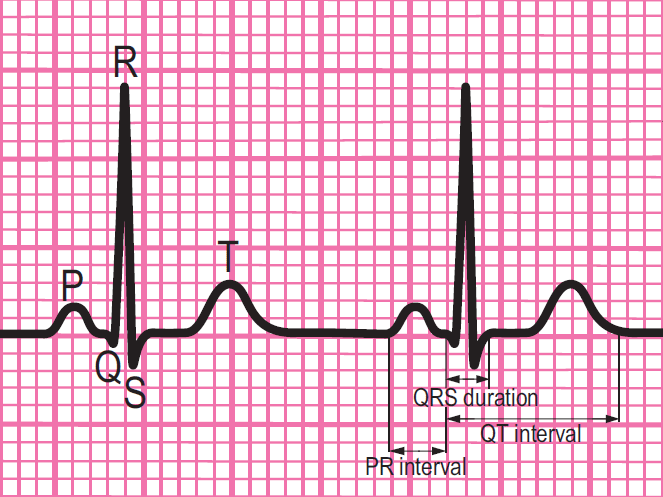
Essentials: Components of a normal ECG rhythm strip
- Depolarisation begins in the SA node and then spreads through the atrial myocardium.
- This depolarisation is recorded on the rhythm strip as the P wave. The heart responds to this electrical stimulus byatrial contraction.
- The small isoelectric segment between the P wave and QRS complex represents the delay in transmission through the AV node.
- Depolarisation of the bundle of His, bundle branches and ventricular myocardium is shown on the rhythm strip as the QRS complex.
- The T wave represents recovery of the resting potential (repolarisation) in the cells of the conducting system and ventricular myocardium.
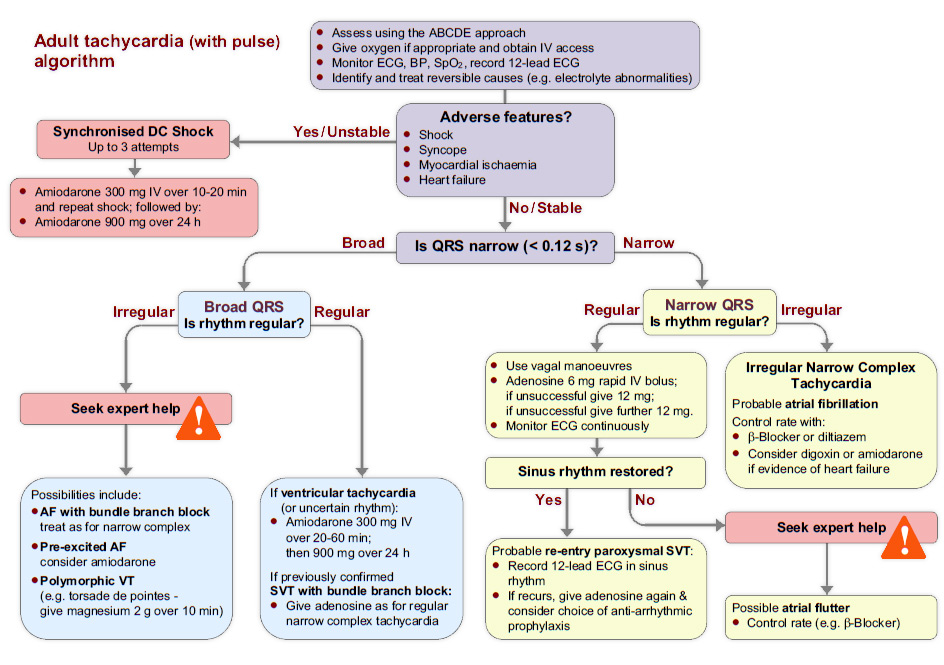
Algorithm: The tachycardia algorithm
The tachycardia algorithm is available in chapter 11 of the ALS manual.
Settings
Font colour
default inverted high contrast high contrast inverted high contrast soft green on blackSample text
text looks like thisTEXT LOOKS LIKE THIS
