
Acute ST-segment-elevation posterior myocardial infarction
We have already recognised that some people with acute coronary syndromes, including acute MI, have ST segment depression on their ECG. In the presence of clinical and biochemical evidence of acute MI this usually indicates non-ST-elevation infarction. There is one exception to this.
Click on one of the circles to find out more.


The main ECG abnormality in people with acute posterior wall STEMI is usually ST segment depression in the anterior leads, a reciprocal change reflecting ST segment elevation at the back of the heart. This ECG shows a typical example. If you see ST depression in leads V1-V3 in this clinical setting, consider recording posterior leads to look for ST elevation, and look for other clues that this may be posterior wall infarction.
Click on one of the circles to find out more. Select Next to continue.
Click on one of the circles to find out more. Select Next to continue.

Although posterior wall infarction can occur without any evidence of involvement of other parts of the left ventricle it is very common to have some evidence of inferior wall involvement as well. This ECG shows a typical example. The dominant abnormality is the reciprocal anterior ST depression, but the inferior leads have some subtle ST segment elevation that gives an additional clue that we are dealing with a posterior wall STEMI.
Click on one of the circles to find out more. Select Next to continue.
Click on one of the circles to find out more. Select Next to continue.


References

See chapter 4 of the ALS manual for further detail relating to the assessment and treatment of Acute Coronary Syndromes.
Acute coronary syndromes: immediate treatment and
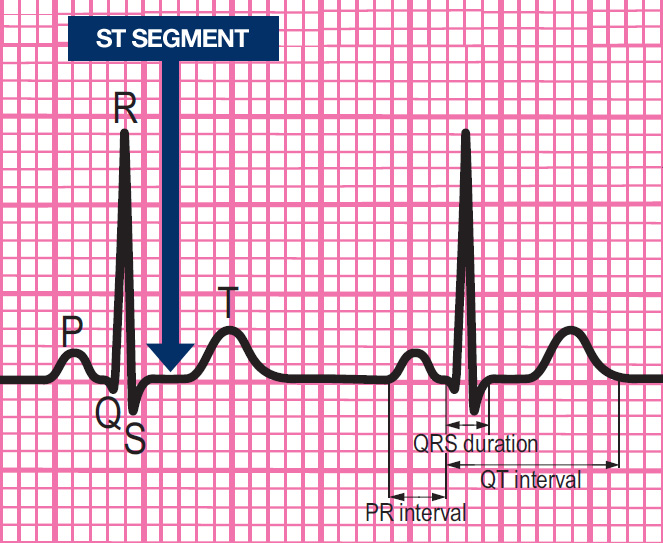
components of a normal ECG rhythm strip
Acute coronary syndromes: immediate treatment
Give immediate treatment to relieve symptoms, limits myocardial damage and reduce the risk of cardiac arrest. Immediate general treatment for ACS comprises:
- Aspirin
- Nitroglycerine
- Oxygen
- Morphine or Diamorphine
Components of a normal ECG complex
- Depolarisation begins in the SA node and then spreads through the atrial myocardium
- This depolarisation is recorded on the rhythm strip as the P wave. The heart responds to this electrical stimulus byatrial contraction
- The small isoelectric segment between the P wave and QRS complex represents the delay in transmission through the AV node
- Depolarisation of the bundle of His, bundle branches and ventricular myocardium is shown on the rhythm strip as the QRS complex
- The T wave represents recovery of the resting potential (repolarisation) in the cells of the conducting system and ventricular myocardium


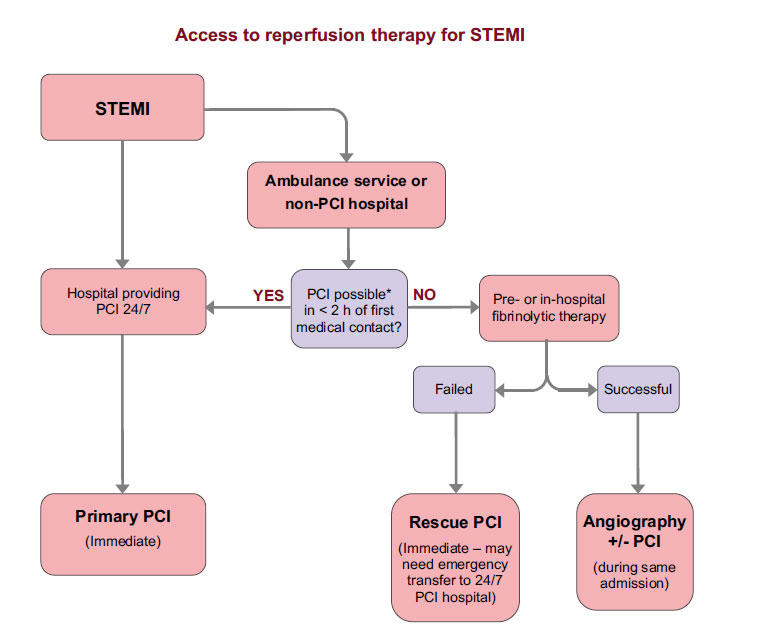
The ABCDE approach and access to reperfusion therapy for STEMI
All patients with a suspected acute coronary syndrome should be assessed using the ABCDE approach.
The ABCDE approach stands for:
- Airway
- Breathing
- Circulation
- Disability
- Exposure
In addition where an ST-elevation MI is evident immediate reperfusion therapy should be arranged unless contra-indicated.
Settings
Font colour
default inverted high contrast high contrast inverted high contrast soft green on blackSample text
text looks like thisTEXT LOOKS LIKE THIS