
Identifying the rhythm – Walter Smith.
Roll over the ECG to see a larger image. Select one of the options and then select Confirm.


No, that is not right. There is electrical activity, so this is not asystole. The P waves have a normal morphology (so the atrial rhythm is sinus rhythm), and a normal rate (so this is not sinus bradycardia). The patient is not in cardiac arrest, so this is not PEA. The atrial impulses are not related to the ventricular impulses.
Mr Smith’s ECG indicates that he is in broad-complex complete AV block.
No, that is not right. There is electrical activity, so this is not asystole. The P waves have a normal morphology (so the atrial rhythm is sinus rhythm), and a normal rate (so this is not sinus bradycardia). The patient is not in cardiac arrest, so this is not PEA. The atrial impulses are not related to the ventricular impulses.
Mr Smith’s ECG indicates that he is in broad-complex complete AV block.
No, that is not right. There is electrical activity, so this is not asystole. The P waves have a normal morphology (so the atrial rhythm is sinus rhythm), and a normal rate (so this is not sinus bradycardia). The patient is not in cardiac arrest, so this is not PEA. The atrial impulses are not related to the ventricular impulses.
Mr Smith’s ECG indicates that he is in broad-complex complete AV block.
No, that is not right. There is electrical activity, so this is not asystole. The P waves have a normal morphology (so the atrial rhythm is sinus rhythm), and a normal rate (so this is not sinus bradycardia). The patient is not in cardiac arrest, so this is not PEA. The atrial impulses are not related to the ventricular impulses.
Mr Smith’s ECG indicates that he is in broad-complex complete AV block.
That is right. There is electrical activity, so this is not asystole. The P waves have a normal morphology (so the atrial rhythm is sinus rhythm), and a normal rate (so this is not sinus bradycardia). The patient is not in cardiac arrest, so this is not PEA. The atrial impulses are not related to the ventricular impulses.
Mr Smith’s ECG indicates that he is in broad-complex complete AV block.


References

See chapter 8 of the ALS manual for further explanation and examples of how to analyse cardiac rhythm from the ECG.
See chapter 11 of the ALS manual for further reading about the management of rhythm abnormalities.
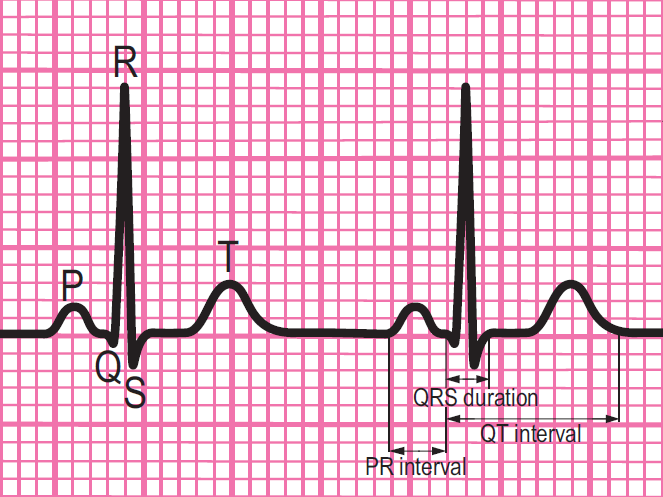
Components of a normal ECG complex
- Depolarisation begins in the SA node and then spreads through the atrial myocardium
- This depolarisation is recorded on the rhythm strip as the P wave. The heart responds to this electrical stimulus byatrial contraction
- The small isoelectric segment between the P wave and QRS complex represents the delay in transmission through the AV node
- Depolarisation of the bundle of His, bundle branches and ventricular myocardium is shown on the rhythm strip as the QRS complex
- The T wave represents recovery of the resting potential (repolarisation) in the cells of the conducting system and ventricular myocardium


The 6-stage approach
1. Is there any electrical activity?
2. What is the ventricular (QRS) rate?
3. Is the QRS rhythm regular or irregular?
4. Is the QRS width normal (narrow) or broad?
Any cardiac rhythm can be described accurately and managed safely and effectively using the first four steps.
5. Is atrial activity present? (If so, what is it: Typical sinus P waves? Atrial fibrillation? Atrial flutter? Abnormal P waves?)
6. How is atrial activity related to ventricular activity? (e.g 1:1 conduction, 2:1 conduction, etc, or no relationship)