
How to read a rhythm strip
Select each heading to find out more.


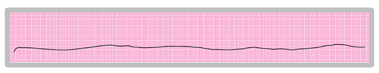
The first stage is to examine the ECG rhythm strip to see if the heart has any electrical activity.
Absence of visible electrical activity may indicate that the patient is in asystole or that there has been loss of the connection between the patient and the monitor or ECG machine, for example due to electrodes falling off or cable not connected to the machine. If the patient has a pulse and there is no electrical activity this confirms such loss of contact. A completely straight line on the ECG also usually indicates loss of contact. The ECG during asystole shows no electrical activity but the baseline is not usually a completely straight line.
Your observations in this step will determine whether you will proceed through the other steps in this process. If the patient has no pulse, and the ECG shows asystole start CPR immediately.
Select Next to continue.
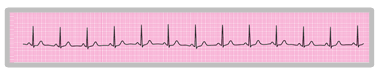
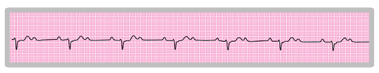
The rhythm strip can be used to calculate the ventricular (QRS) rate. The strip itself is calibrated in mm, with bolder lines every five mm. Standard paper speed in the UK is 25 mm s -1, which means that one second is represented by five large squares on the paper (25 small squares).
Heart rate (in beats per minute) can be estimated by counting the number of cardiac cycles that occur in six seconds (30 large squares) on the rhythm strip and multiplying this number by ten.
- The normal heart rate (ventricular rate) at rest is 60 – 100 beats min-1
- A bradycardia has a heart rate slower than 60 min-1
- A tachycardia has a heart rate faster than 100 min-1
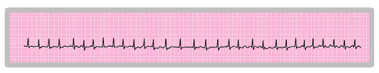
In order to discover if the QRS rhythm is irregular measure out each R-R interval and compare it to others in the rhythm strip.
If the QRS rhythm is irregular you will need to decide:
- Is this totally irregular, with no recognisable pattern of R-R interval?
- Is the basic rhythm regular, with intermittent irregularity?
- Is there a recurring cyclical variation in the R-R intervals?
or prolonged (broad)?
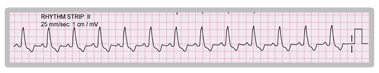
The upper limit of normal for the QRS duration is 0.12 s (3 small squares on ECG paper at 25 mm s-1). If the QRS width is less than this, the rhythm almost certainly originates from above the bifurcation of the bundle of His and may be from the SA node, atria or AV node, but not from the ventricular myocardium.
If the QRS duration is 0.12 s or more the rhythm may be coming from ventricular myocardium or may be a supraventricular rhythm, transmitted with aberrant conduction (i.e. bundle branch block).
Select Next to continue.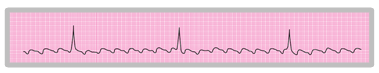
The shape and direction of atrial activity on the ECG helps to identify what it is and where it is coming from. During sinus rhythm in a healthy person P waves are usually positive deflections in lead II and shallow, biphasic deflections in V1. For example:
P waves of different morphology may be arising from another part of the atria (ectopic atrial rhythm).
During a sustained tachycardia with a rapid QRS rate, atrial activity may not be visible between the QRS complexes. It is important not to persuade yourself that you can see atrial activity unless you are sure that it is visible.
Other types of atrial activity may be identified.
- During atrial fibrillation there are waves of depolarisation travelling in various directions through both atria. This is best seen in lead V1 as irregular electrical activity that varies in amplitude and frequency. Normal P waves are absent
- During atrial flutter, atrial activity is seen as flutter waves - an absolutely regular repetitive deflection with a ‘saw-tooth’ appearance, often at a rate of 260-300 min-1. Typical atrial flutter is seen best in the inferior ECG leads (II, III, aVF)
P wave rate and regularity (and flutter wave rate) can be inspected in the same way as the rate and regularity of QRS complexes.
Select Next to continue.and if so, how?
A relationship between atrial and ventricular activity can be determined by examining a long ECG rhythm strip for the presence or absence of variations in the PR interval. Careful examination is important as these may be subtle.
If there is a consistent interval between each P wave and the following QRS complex, it is likely that conduction between atrium and ventricle is occurring with each beat and that ventricular depolarisation is triggered by atrial depolarisation. If there are variations in the PR interval and the QRS rate is slower than the atrial rate this is likely to indicate a degree of heart block.
In other circumstances careful inspection will detect no relationship between the timing of P waves and of QRS complexes, indicating that atrial and ventricular depolarisation is arising independently, sometimes referred to as atrioventricular dissociation.
Select Next to continue.


References

See chapter 8 of the ALS manual for further reading about the physiology of the ECG.
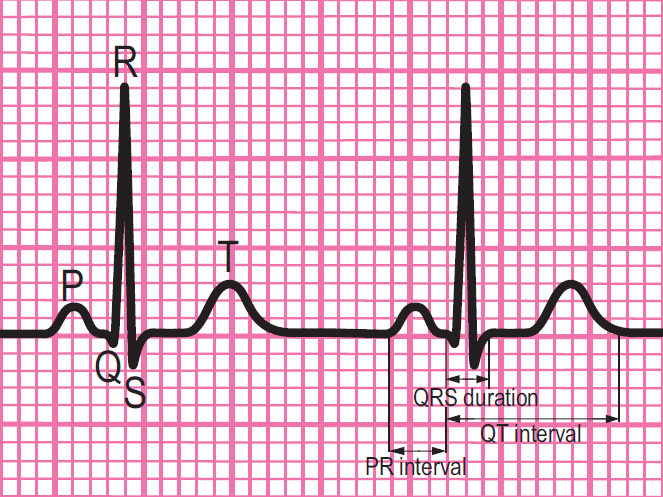
Components of a normal ECG complex
- Depolarisation begins in the SA node and then spreads through the atrial myocardium
- This depolarisation is recorded on the rhythm strip as the P wave. The heart responds to this electrical stimulus byatrial contraction
- The small isoelectric segment between the P wave and QRS complex represents the delay in transmission through the AV node
- Depolarisation of the bundle of His, bundle branches and ventricular myocardium is shown on the rhythm strip as the QRS complex
- The T wave represents recovery of the resting potential (repolarisation) in the cells of the conducting system and ventricular myocardium


The 6-stage approach
1. Is there any electrical activity?
2. What is the ventricular (QRS) rate?
3. Is the QRS rhythm regular or irregular?
4. Is the QRS width normal (narrow) or broad?
Any cardiac rhythm can be described accurately and managed safely and effectively using the first four steps.
5. Is atrial activity present? (If so, what is it: Typical sinus P waves? Atrial fibrillation? Atrial flutter? Abnormal P waves?)
6. How is atrial activity related to ventricular activity? (e.g 1:1 conduction, 2:1 conduction, etc, or no relationship)