
Cardiac arrest rhythms
Select each heading to find out more.

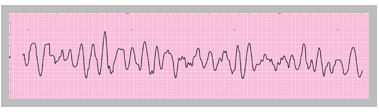
VF is usually easy to recognise from the ECG rhythm strip. If a patient is in VF they need immediate defibrillation. If the patient has a pulse then the rhythm is not VF.
The rhythm abnormality that is most likely to be mistaken for VF is polymorphic VT (Torsades de Pointes VT). Patients may be pulseless and lose consciousness during this rhythm; it may terminate spontaneously, or may degenerate into VF. If this rhythm is present and the patient is in clinical cardiac arrest the appropriate treatment is defibrillation, so mistaking the rhythm for VF will not result in inappropriate treatment.
Pre-excited atrial fibrillation (AF) produces an irregular broad complex tachycardia that is sometimes mistaken for VT and could in theory be mistaken for VF. If pre-excited AF causes adverse features without cardiac arrest, the correct treatment is synchronised cardioversion, so mistaking the rhythm for VT will not lead to inappropriate treatment. If pre-excited AF causes cardiac arrest and is mistaken for VF or pulseless VT, immediate defibrillation will be likely to correct the rhythm, although synchronised cardioversion would have been preferable.
Select Next to continue.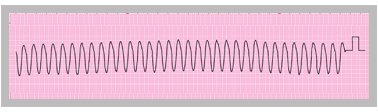
VT may generate a detectable cardiac output (i.e. pulse) in some situations but in others may cause loss of cardiac output resulting in cardiac arrest. It may also degenerate into VF.
In VT the QRS morphology may be:
- Monomorphic – a regular rhythm strip pattern
- Polymorphic – the morphology of the QRS complexes varies from complex to complex – one form of polymorphic VT is Torsades de Pointes VT, in which there is a sinusoidal pattern of variation in QRS amplitude
The importance of documenting and recognising these rhythms is to ensure that the patient receives immediate and appropriate specialist treatment to protect them from recurrence of this potentially dangerous arrhythmia and from sudden death as a result.
Select Next to continue.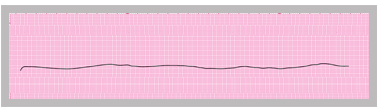
If the patient is pulseless and there is no electrical activity on the ECG, this is asystole. The absence of any electrical activity indicates asystole in atria as well as ventricles. Occasionally ventricular asystole (sometimes called ventricular standstill) occurs in the presence of continued P wave activity in the atria. Atrial contraction alone will not maintain cardiac output, so cardiac arrest will be present, but patients with ventricular standstill and continued P wave activity may have a better chance of survival as cardiac pacing may restore ventricular contraction.
Sometimes during cardiac arrest it is not certain whether the ECG shows asystole or very fine VF. The best treatment in this situation is immediate high quality CPR. If the patient was in fine VF then good CPR may increase the amplitude and frequency of VF, making it easier to identify and more likely to respond to defibrillation. If the patient is in asystole, CPR is the appropriate treatment and the presence of asystole is likely to be recognised by its persistence.
Select Next to continue.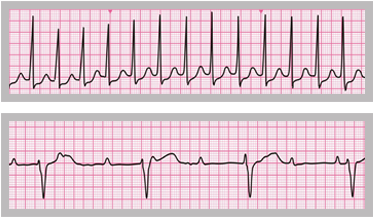
PEA does not refer to a specific cardiac rhythm. It defines the clinical absence of cardiac output despite electrical activity that would normally be expected to produce a cardiac output.
It often has a poor prognosis, especially when caused by large acute myocardial infarction. Other treatable causes include:
- Massive pulmonary embolism
- Tension pneumothorax
- Cardiac tamponade
- Acute, severe blood loss


References

See chapter 8 of the ALS manual for further explanation and examples of how to analyse cardiac rhythm from the ECG.
See chapter 11 of the ALS manual for further reading about the management of rhythm abnormalities.
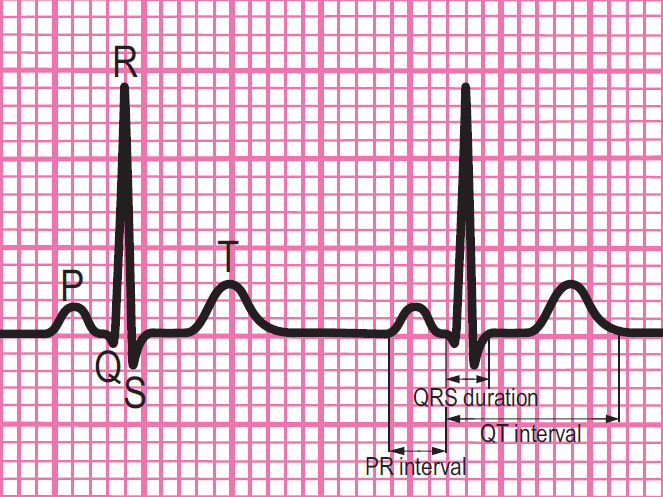
Components of a normal ECG complex
- Depolarisation begins in the SA node and then spreads through the atrial myocardium
- This depolarisation is recorded on the rhythm strip as the P wave. The heart responds to this electrical stimulus byatrial contraction
- The small isoelectric segment between the P wave and QRS complex represents the delay in transmission through the AV node
- Depolarisation of the bundle of His, bundle branches and ventricular myocardium is shown on the rhythm strip as the QRS complex
- The T wave represents recovery of the resting potential (repolarisation) in the cells of the conducting system and ventricular myocardium


The 6-stage approach
1. Is there any electrical activity?
2. What is the ventricular (QRS) rate?
3. Is the QRS rhythm regular or irregular?
4. Is the QRS width normal (narrow) or broad?
Any cardiac rhythm can be described accurately and managed safely and effectively using the first four steps.
5. Is atrial activity present? (If so, what is it: Typical sinus P waves? Atrial fibrillation? Atrial flutter? Abnormal P waves?)
6. How is atrial activity related to ventricular activity? (e.g 1:1 conduction, 2:1 conduction, etc, or no relationship)